Graph Drawing [1/9]
Graph Drawing
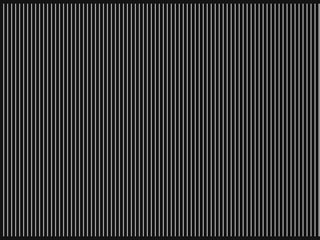
This program draws vertical lines. The lines are 50 pixels apart. Top line ends are at coordinate y = 10, and the other line ends are at y = 710.
Exercise:
Change the program so that the lines are 8 pixels apart. Also, reduce the sleep time so that the image is drawn faster.
The solution is on the next slide.
In this program, top line ends are at coordinate y = 10, and the bottom line ends are at y = 710.
Exercise:
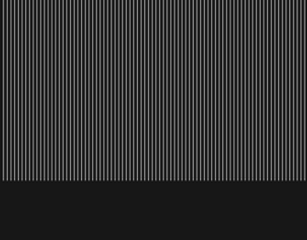
Change the program so that the bottom (i.e. second) line ends are at coordinate y = 500.
The solution is on the next slide.
In this program, top (i.e. first) line ends are at coordinate y = 10, and the bottom (i.e. second) line ends are at y = 500.
The line function has the form:
line(x1, y1, x2, y2)
Exercise:
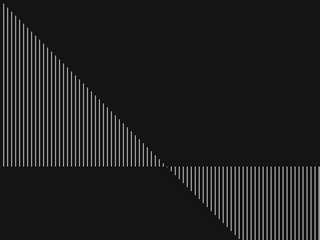
Change the program so that top (i.e. first) line ends are at coordinate y = i.
The solution is on the next slide.
The line function has the form:
line(x1, y1, x2, y2)
Exercise:
Change the program so that first line ends are at coordinate y = i*i/600. Place the other line ends at y = 500.
The solution is on the next slide.
The line function has the form:
line(x1, y1, x2, y2)
Exercises:
1. Change the program so that the lines are 1 pixel apart instead of 8 pixels.
[Run the program]

2. Position the second line ends at coordinate
y = i .
[Run the program]
3. Make the image be drawn even faster.
[Run the program]
The solution is on the next slide.
The provided source code is the solution of the previous exercise.
Open-ended exercise:
Waving Curve
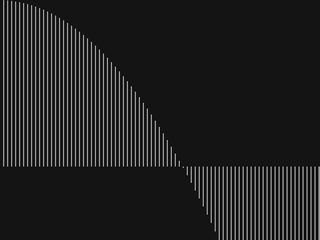
1. Make a waving curve: Change the program so that first line ends are at coordinate
y = 200*sin(i/70)+500 . Place the other line ends at
y = 500 .
[Run the program]
The sin (sine) function can be used to create waves. Don't be afraid of the sine function, even if you don't know anything about it.
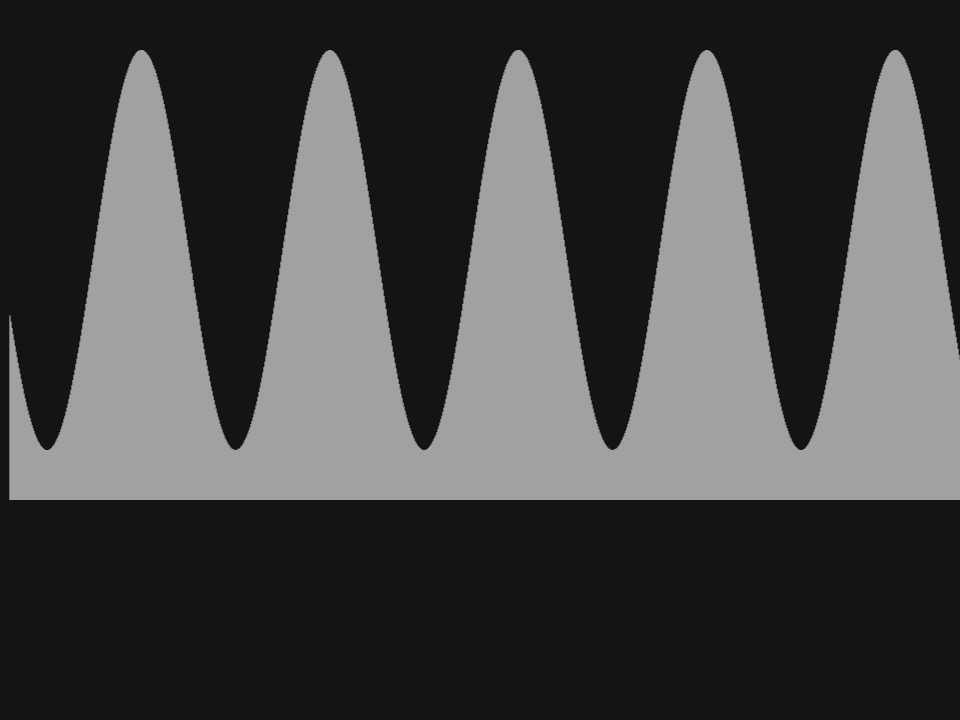
2. After you have made a waving curve, experiment with changing the literal numbers to produce various other waves. Change the numbers 200, 70 and 500 into some other numbers to see how it affects the shape of the wave. You can also try to find the number that produce a shape matching the one in the image below.
Run this demonstrational program that draws a strange shape. It uses two calls to the sin (sine) function in order to produce two twining waves.
The program is too complex to be analyzed in detail. You can experiment with changing the literal numbers 360, 200, 60 and 90 to produce various other twining curves.
This exercise is very easy to solve if you follow the instructions. In this exercise, you don't need to analyze the given program in detail (but you can if you want to), and you don't have to be familiar with the mathematical concepts involved.
Run the given program first.
This program draws a graph of mathematical function x *x. Values of this function are calculated by expression x*x and stored in the variable fval. Find this expression in the source code of the program.
Exercise:
Make the program draw a graph of mathematical function
- x + 2
Solution
#num fval = x + 2;
What happens when the variables x0 and y0 are initialized to some other values? Try it out.
This exercise should also be easy. Run the given program first.
What happens when the variable unit is initialized to some other value? Try out values 70, 140, 200, 40.
You can change the initial values of variables x0 and y0 to move the graph around the screen. Change the initial value of variable unit to zoom in or out.
Exercises:
Make the program draw a graph of mathematical function
- x * 3
Solution
#num fval = x * 3;
Make the program draw a graph of the following mathematical functions:
- x*2
- x*1
- x*0.5
- x*0 + 3
- x.round
- x.int
- sin(x)
- 2*sin(3*x)
- 3*sin(5*x)+1
- sin(x*x)
- x*sin(x*x)
- -x*x + 5
- 1/x
(For mathematicians only) The last one might present a problem due to division by zero. There are numerous ways to solve it. Can you find a way?
Solution for 1/x:
It is probably the easiest to move the origin by half a pixel:
#num x0 = 480.5;
This slide ends the tutorial on Graph Drawing.
Click on the 'Articles' button at the top to select another article. We also suggest taking a peak into our main 'Gallery' of programs, and taking a look into 'Overview' of our main programming tutorial for beginners. Have fun!
<< F2:Prev - - F4:Next >>